
In a previous article, we saw the goodness of stirring a little Micrometer into our Spring Boot 3 application to trace what our application did. We saw how to activate the Micrometer bindings buried deep in Spring Boot for web calls. And we piped all those good metrics into Zipkin, the open source distributed tracing system thanks to Docker.
But that wasn’t very “realistic” cuz we didn’t have a “real” database underneath it.
Everyone know that real apps have data, right? So why not put something together!
To kick things off, after fashioning an app using start.spring.io, Spring Data JPA, and H2, we need a domain object. Let’s craft something like this:
@Entity
public class Employee {

 @Id
 @GeneratedValue private Long id;
 private String name;
 private String role;

//...constructors/getters/setters ommitted for brevity...
}
A basic domain object that lets us model the Employees in our payroll system. This entity class is properly annotated with @jakarta.persistence.Entity (remember Spring Boot 3 is on Jakarta EE 10!). It also has the id field marked up as the primary key using @jakarta.persistence.Id. We will also let the JPA persistence provider handle primary key generation by using @jakarta.persistence.GeneratedValue.
Even though Spring Data provides some cool features, we STILL have to model our entity classes properly for things to come together!
Since we’re using Spring Data JPA, we also need to define a repository. So let’s do something like this:
public interface EmployeeRepository extends JpaRepository<Employee, Long> {}This barebones interface definition extends Spring Data JPA’s JpaRepository and defines its domain type as Employee and the primary key type as Long. Even though our interface definition is empty, it still comes packed with LOTS of options. (Just visit JpaRepository and its parent interfaces inside your IDE to see exactly what you get!)
The rest of the application is just a Spring MVC @RestController, much like what we had in the previous article, shown below:
@RestController
public class EmployeeController {

 private final EmployeeRepository repository;

 public EmployeeController(EmployeeRepository repository) {
 this.repository = repository;
 }

 @GetMapping("/api/employees")
 List<Employee> all() {
 return repository.findAll();
 }

 @GetMapping("/api/employees/{id}")
 Employee one(@PathVariable Long id) {
 return repository.findById(id) //
 .orElseThrow(() -> new RuntimeException("Employee " + id + " not found!"));
 }
}
This REST controller will inject our EmployeeRepository bean into the controller and then use it to either find ALL employees, or just one.
So where is all this magical tracing?
Good question. The answer is…it’s not here yet. That’s because we need a few additional things in our project.
- When building our app inside start.spring.io, we must also include Spring Boot Actuator.
- We also need to add Micrometer and its bridge for Zipkin.
<dependency>
 <groupId>io.micrometer</groupId>
 <artifactId>micrometer-observation</artifactId>
</dependency>
<dependency>
 <groupId>io.micrometer</groupId>
 <artifactId>micrometer-tracing-bridge-brave</artifactId>
</dependency>
<dependency>
 <groupId>io.zipkin.reporter2</groupId>
 <artifactId>zipkin-reporter-brave</artifactId>
</dependency>- Almost there. We just need one teensy little dependency:
<dependency>
 <groupId>net.ttddyy.observation</groupId>
 <artifactId>datasource-micrometer-spring-boot</artifactId>
 <version>1.0.0-SNAPSHOT</version>
</dependency>
This last dependency is a special module that will wrap ANY DataSource bean with a proxy that uses Micrometer APIs to log actions.
JPA speaks DataSource?
Yup.
DataSource is an interface from the JDBC spec. And JDBC is the standard through which ALL Java applications speak to database. So every JPA app, every jOOQ app, every Querydsl app speaks JDBC when it comes to linking up with relational databases.
Wrap a DataSource bean and you can trace ANY relational database application with Micrometer.
BTW, R2DBC is another Java standard used to talk to relational databases, and that is ONLY for reactive applications, not what we’re doing today.
Apply these settings to our application.properties file:
# Trace every action
management.tracing.sampling.probability=1.0
…and we’re set! Time to launch the app and give it a spin. (Don’t forget to be running Zipkin from Docker Desktop).
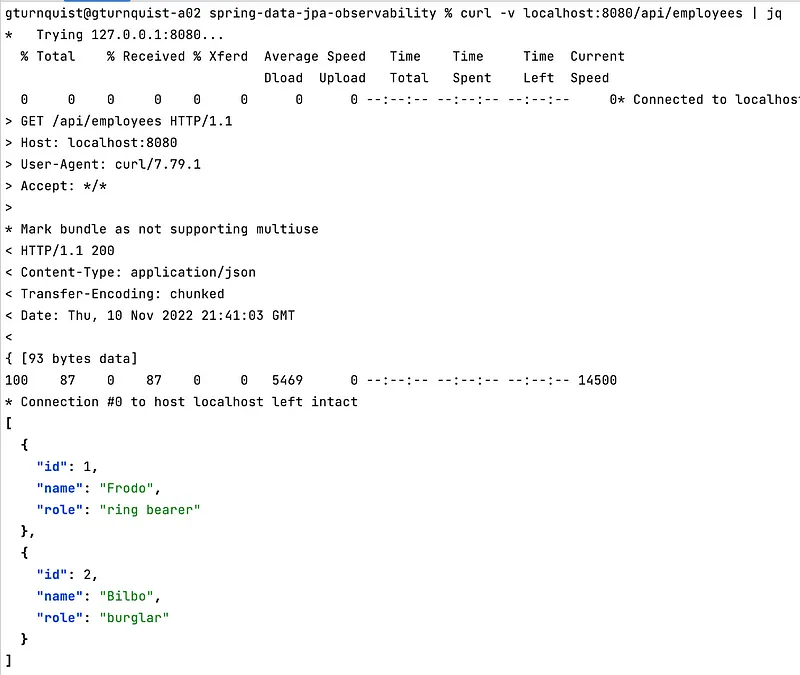 Query the endpoint, and we have our outputs from that controller class we just built. Now let’s go see what it says in Zipkin.
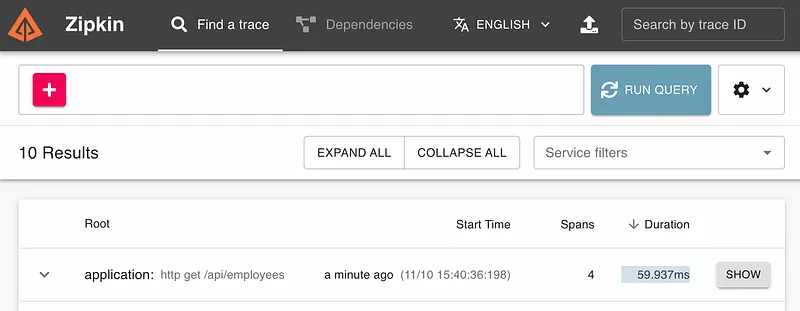 Querying for traced, we can see http get /api/employees. Looks like what we want. Click on SHOW and we should see this:
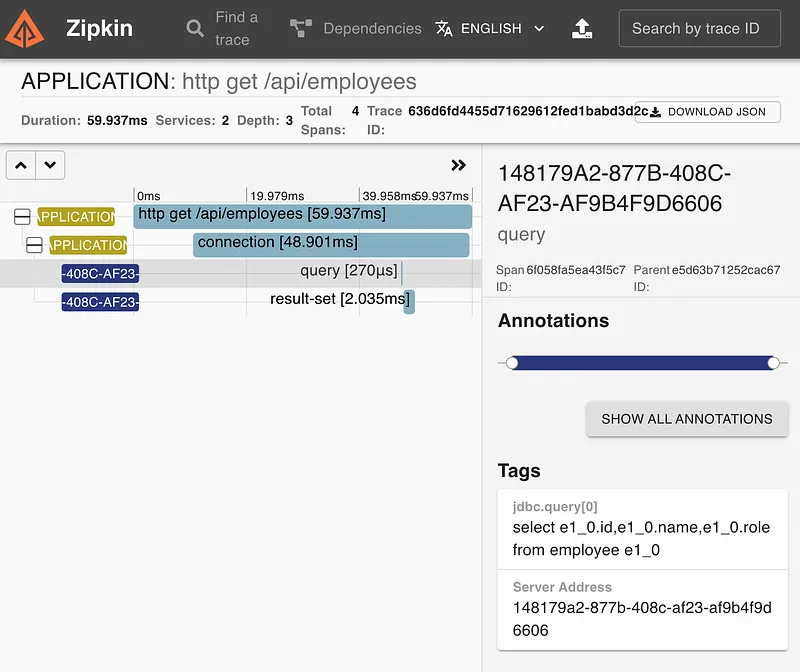 We can see from the left-hand side, that Spring MVC traced the call to http get /api/employees. From there a connection was opened. Then a query was made against the database followed by processing a result set.
By clicking on the query box, we can see the tags on the right hand side, including the jdbc.query that was executed. And we see that a JPA query, fashioned for by Spring Data JPA’s query derivation layer, was ultimately transformed into a JDBC query by Hibernate’s Entity Manager.
And the query itself only took 270 microseconds. Looks like this query doesn’t much in the way of tuning, ehh?
But these tools now provide the means to track down what DOES take a long time. Maybe one of the queries you build is just not every efficient and needs to be rewritten? Or perhaps something else is fault in the assumptions made.
Either way, these give us some nifty tools to measure results and effect change!
If you want to see more articles about Spring Boot in general, then please stay tuned for my next article. But if you simply can’t wait, then check out the video below where we learn a little more of what JDBC is all about.
— Greg
Do you want to get a free tech e-book, be alerted to my discounts, and get even MORE content about SPRING BOOT? Then SIGN UP FOR MY NEWSLETTER.